Similarity to SDSS filters
The g,r,i and z filters are similar to, but not identical to their SDSS counterparts. There are color terms for converting between SDSS and DES magnitudes which can amount to 10%.The Y-band filter is at ~ 1 micron.
Size of the filters -- uniformity
The filters are physically very large, covering the 3 square degree field of view of DECam, and while they are quite uniform in response, there are some center-to-edge variations in the response of the filters to objects of different color. The largest of these (in the DES-used grizY set, i.e. excluding u, VR bands), is i-band, where there is a 1% gradient in the color response from center to edge. DES is not currently correcting for such variation, and thus your object colors could be off by as much as 1% due to this effect.
Relative Photometric Calibration
The relative photometric calibration of the data is expressed in terms of colors (rather than magnitudes). This is for two reasons:- Colors are the relevant quantity for getting to science quantities such as stellar types and galaxy photo-zs.
- It is more difficult to check a magnitude calibration in isolation.
- g-r: 2% (1-sigma rms), few outliers from a Gaussian distribution
- r-i: 1.5%
- i-z: 2%
- z-Y: 2% (less certain)
These quantities are determined by performing an analysis of the position of the stellar locus in dereddened color-color-color space vs. some fiducial locus as described by P. Kelly et al: http://arxiv.org/abs/1208.0602 with source code available to perform the tests at http://ascl.net/1208.007.
The Y-band magnitude accuracy is not as well known, but is expected to be similar in accuracy to the z band data; that is approximately 2% in z-Y colors.
These distributions of color errors vs. a dereddened stellar locus are roughly Gaussian (see Figure below). There are relatively few outliers.
These numbers give conservative, color-based estimates of photometric accuracy.
Absolute Photometric Calibration
Absolute calibration takes two forms:- Absolute flux in some band in physical units
I.E. For an object with a specified r-band magnitude, what is the flux of that object in physical units such as ergs/cm/cm/s/Angstrom averaged over same wavelength bandpass?
- Spectral tilt calibration across filters
What is the filter-to-filter 'absolute tilt' of
the fluxes relative to each other? This is crucial for comparing cosmological measurements of
supernovae peak brightnesses for example over a range of redshifts.
These issues will be explored in depth by DES in future Data Releases. For now, we conservatively estimate the absolute zeropoints of the r,i filters to be within 2%, the g,z to be within 3% and the Y to be 5% of absolute. (Tucker et al. in prep, Wester et al. in prep). These estimates can be obtained by comparing the measured magnitude of known objects, such as horizontal branch stars in the globular cluster M2, which is in the data set, with literature magnitudes for these same stars.
The PSF magnitudes of stars on science exposures were measured by the PSFEx and Sextractor codes available at astromatic.net (Bertin). No extra aperture corrections were applied beyond the astromatic default behavior for PSF magnitudes.
Photometric depth of the exposures:
The 3-sigma detection limit for point sources is approximately:- g,r,i: 23.0
- z: 22.0
- Y: 20.3
for exposures taken in typical good conditions, defined as:
- Seeing < 1.2 arcsec FWHM
- Airmass < 1.4
- Minimal clouds
Exposure times for DES widefield survey exposures:
- g,r,i,z: 90 seconds
- Y: 45 seconds
Figures documenting the photometric quality of the Y1A1 FINALCUT STRIPE82 release
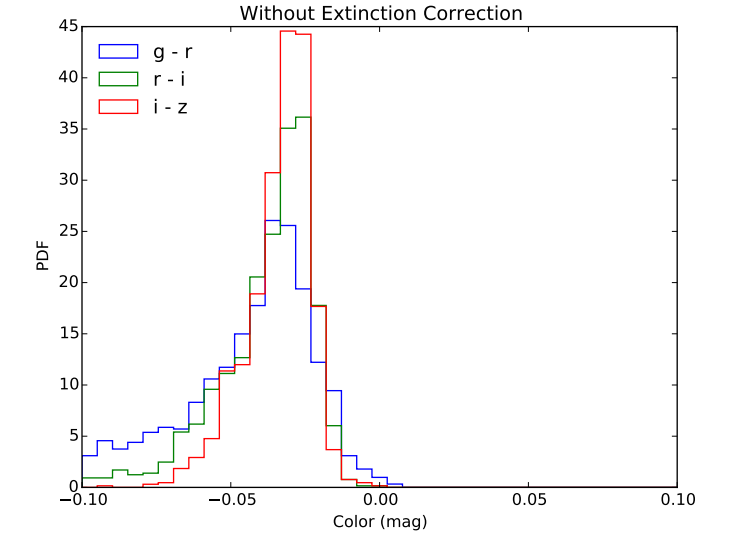
Figure 1: difference between Y1A1 STRIPE82 subset stars (colors not dereddened) and fiducial stellar loci (not dereddened). The FWHM width of the residuals is about 2% with non-Gaussian tails. The non-zero offset of the residuals is being investigated, but implies no worse than a 2% absolute offset in the DECam griz filter system relative to an AB system.
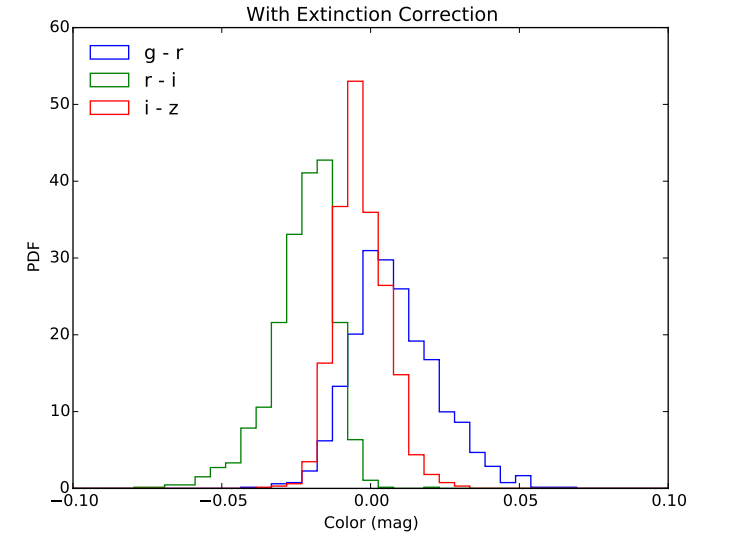
Figure 2: difference between Y1A1 STRIPE82 subset stars and fiducial stellar loci (DES star colors and fiducial loci dereddened). The FWHM width of the residuals is about 2% with a non-Gaussian tail for the g-r color residual. The non-zero offset of the residuals is being investigated, but implies no worse than a 2% absolute offset in the DECam griz filter system definition relative to an AB system.
Figures documenting the photometric quality of the Y1A1 FINALCUT SPT release
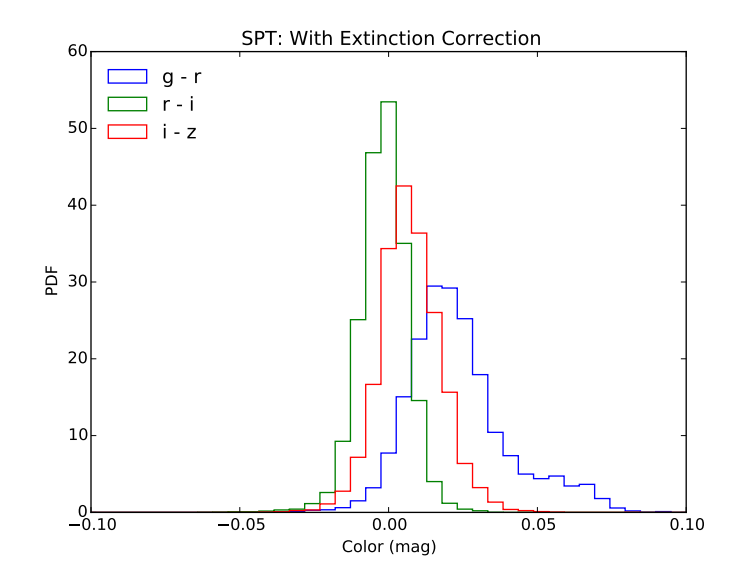
Figure 3: difference between Y1A1 SPT subset region stars (colors dereddened) and fiducial stellar loci (dereddened). The FWHM width of the residuals is about 2% in r-i, i-z with Gaussian tails. In g-r, there is a non-Gaussian tail extending to 7%. This corresponds to the western most region in RA (see figure below), where the g-band calibration may be off by ~5%. The non-zero mean of the residual peaks indicates no worse than a 2% absolute offset in the DECam griz filter system relative to an AB system.
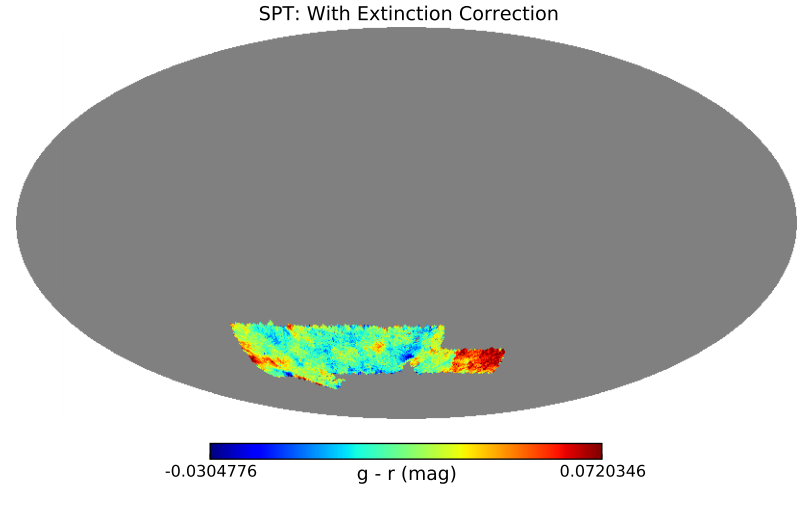
Figure 4: g-r Residual Map in RA/DEC for SPT area. The RA extends from 100 degrees on the left down through 0 degrees to -60 (300 degrees) at the right hand side of the footprint. In DEC, the primary footprint runs from -60 to -40 degrees. There is a region in the west (RA~300 degrees) where the g band calibration may be off by 5% systematically. Aside from this region, the g-r calibration is better than 2% rms.
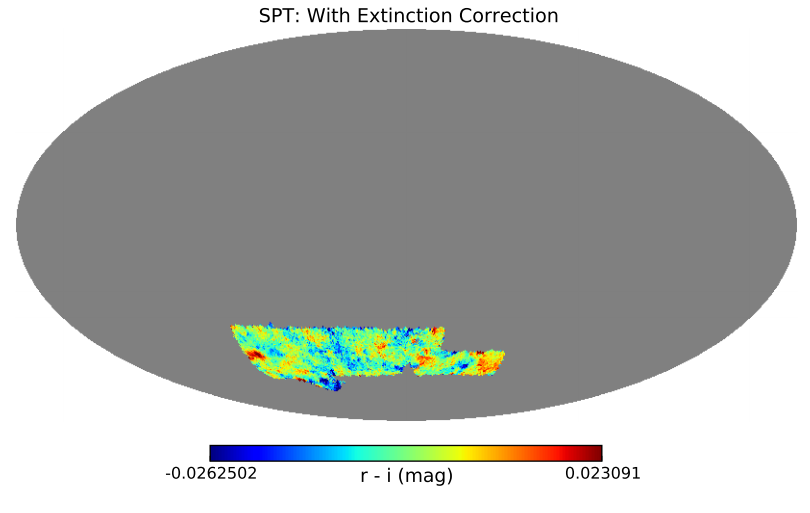
Figure 5: r-i Residual Map in RA/DEC for SPT area. The RA extends from 100 degrees on the left down through 0 degrees to -60 (300 degrees) at the right hand side of the footprint. In DEC, the primary footprint runs from -60 to -40 degrees. The r-i calibration is better than 2% rms.
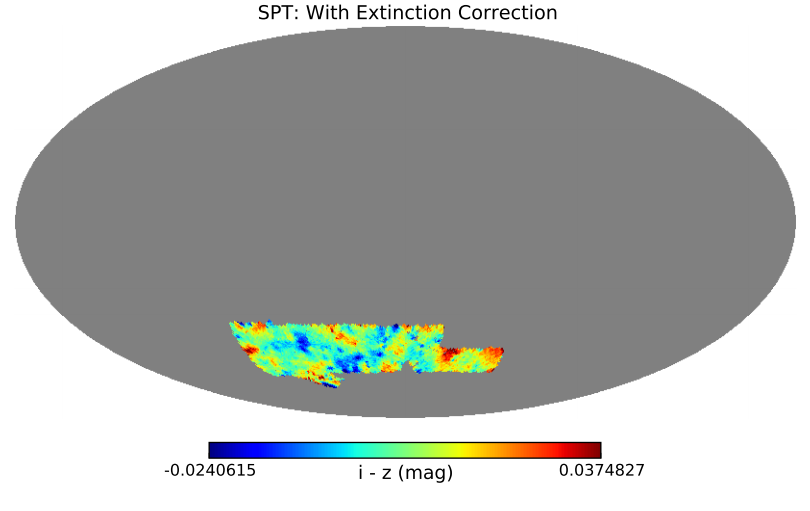
Figure 6: i-z Residual Map in RA/DEC for SPT area. The RA extends from 100 degrees on the left down through 0 degrees to -60 (300 degrees) at the right hand side of the footprint. In DEC, the primary footprint runs from -60 to -40 degrees. The i-z calibration is better than 2% rms.
The patch size for these SLR Stellar Locus Regression tests is 0.21 deg^2. There are about 1300 non-overlapping pixels in this test in the STRIPE82 region and about 10x that number in the SPT region.
Figure and SLR test credits: Keith Bechtol (U Chicago, DES)
Astrometric quality of the data
Coordinate System representation
The conversion between pixel and coordinate on the sky was done using the astromatic.net Scamp program of Bertin (astromatic.net). The World Coordinate System (WCS) information for each ccd in each exposure is stored in the header of each image. Terms are kept up to the cubic terms in x and y pixel in the TPV representation (see FITs WCS reference). There are 10 PV terms in each coordinate, with the 'radially symmetric' terms in the TPV representation (x^2+y^2) are forced to zero.DECam pixel scale, distortion
The pixel scale of DECam averages 263 mas/pixel, with a smooth variation in scale from center-to-edge of about 0.5%.
Absolute Astrometry
Each exposure is indepdently absolutely astrometrically calibrated against the UCAC-4 set of astrometric reference stars using SCAMP (Bertin,astromatic.net). Typical absolute residuals are 1-sigma rms of 200 milli-arcseconds in each coordinate against the UCAC-4 catalog. Users should also note that the initial match to the UCAC-4 catalog does not remove or precess stars of high proper motion from the reference or matching catalogs. This will be corrected in future releases, and is expected to bring the per coordinate rms down from typically 200 mas per coordinate to 100 mas/coordinate or less (absolute, close to the reference catalog accuracy of ~50 mas/coord).
Relative Astrometry
Please also note that any overlapping exposures in the release are *not* registered against each other...each geometric solution is independent.Thus, we strongly recommend that users who are interested in multi-filter or multi-epoch combinations of the released exposures perform their own followup joint registration of overlapping exposures using a program such as SCAMP (astromatic.net).
DES performs this followup registration operation itself, and currently obtains residuals of < 20 mas relative astrometry. Without performing this registration, independent overlapping exposures in the same or alternate filters only match to within about 50 mas rms, with some excursions exceeding 100 mas.
Users should also be aware that even 20 mas relative astrometry can be improved upon by removing such instrumental features as 'tree-rings' (see Plazas, Bernstein and Sheldon 2014 PASP 126, 942, arXiv:1403.6127) and the DES will be implementing these corrections in future releases. It should be possible to ultimately obtain positions of a few mas/coordinate for an individual bright, unsaturated (16th < r< 18th mag) star measurement.
Image format
A mosaic of all 62 CCDs in the DECam is called an exposure. The DECam CCD numbering conventions are shown in this map:
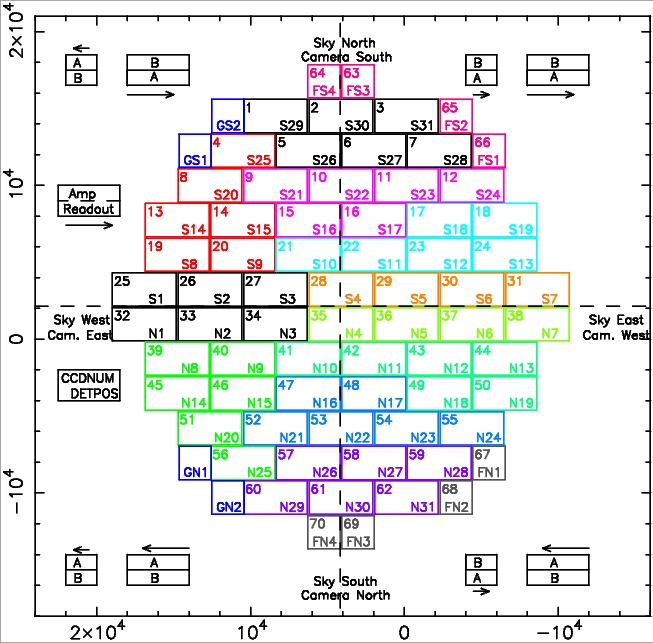
Figure 7: DECAm Mosaic, with numbers of all 62 imaging CCDs labeled (CCDNUM) 1-62.
The guiding and focus chips (numbers > 62 or without CCDNUMs) are generally not used for processing.
A single 2k x 4k CCD image from an exposure is called an image.
The raw CCD images are processed into three end product image planes:
- raw image:
This contains the counts per pixel including all gain response variations. There are also overscan pixels attached to the sides and top and bottom of these raw images.
- reduced image:
This is the processed image, with counts convertible to magnitudes via a simple header-contained zeropoint and y,x positions convertible to RA,DEC using the header WCS coefficients.
- weightmap image:
This is a floating point inverse variance weight map image, the same dimensions as the reduced image , with the level at each pixel representing the relative weight to assign to that pixel, in an inverse variance sense. Roughly, after correcting for gains and the presence of objects, the value in the weight map is approximately 1/N per pixel, where N is the gain corrected level of counts/pixel in the reduced image.
Where there are saturated star pixels or cosmic rays or bad pixels from the bad pixel map, the weight of these pixels are set to 0.
- bitmask image
This 16 bit mask plane, the same dimensions as the reduced image, gives non-zero values where there is some defect or some interpolation has been done on the reduced image.
The bitmask plane values are:
- 0: no mask bit set --- image data is good
- 1: Bad Pixel Mask -- pixel is bad
- 4: Interpolation has been done to this pixel
- 8: Cosmic Ray affects this pixel
- 512: Edge bit -- this pixel is near the edge of the image
- ???: Saturated Star
- ???: Satellite Trail
- ???: Edge Bleed
Processing steps:
A number of standard processing steps are applied to each exposure (Gruendl et al. 2015, in prep). For this release these steps are:- Crosstalk correction: The 62 two-amp CCDs of the DECam camera are
divided between about 11 electronic cards (indicated with different colors in the above figure).
59 CCDs currently fully functional.
- CCDNUM=61 has not been functional since the beginning of Year 1
- CCDNUM=2 went bad in late Nov 2013
- CCDNUM=31 is functional, but one of its amps has a time variable gain (could be corrected in software)
These three CCDs are left out of the current release.
CCDs on the same backplane card can share crosstalk at the 10^-4 to 10^-6 level. The largest crosstalk effect is between amps on the same CCD. This processing step uses a matrix of coefficients to subtract light multipled by a factor (10^-6 to 10^-4, which may be negative or positive in sign) and corrects neighboring amps and chips. The SATURATION level of each CCD is relevant to the crosstalk corrections made. The SATURATION level of each amp of each CCD is kept in a SATURAT[AB] header keyword (for A, B amps, respectively). These values are approximate, and may be overridden by a look up table containing more recent values during processing
- Non-linearity (low light and high light levels):
- A. low-light level nonlinearity
A few (about 10) of the 62*2 ccd-amp combinations are affected by non-linear response to low light levels (generally below 300 ADU/pixel). For DES exposures, this affect short (15s) standard star observations and g band 90s observations. For most other filters/exposure times, the night sky alone is enough to give sufficient counts/pixel to make the non-linearity correction neglible. The effect can be as much as several percent at very low light levels.
- B. high-light level nonlinearity
At very high exposure levels (> 20000 ADU/pixel), there is also a small non-linear behavior (<= about 2%) which is corrected for. A fixed look up table, derived from calibration exposures obtained during the Science Verification period, is used to apply these corrections.
- A. low-light level nonlinearity
- Overscan and Bias
A constant level is fitted to the overscan regions of each row of each amp of each chip and subtracted off.
A bias frame is constructed from the average of ~50 zero second exposures and is also subtracted off of each ccd to remove fixed pattern noise.
The overscan step has the effect of removing overscan rows and columns from the raw images (which are larger than 2k x 4k) , leaving 2k x 4k images.
- Flat field
An average of 10-100 dome flats (separately generated for each filter) are divided into the science exposure. This has the effect of approximately removing the so-called 'tree ring' and 'tape bumps' in a photometric sense. In fact, these features are astrometric (the pixels are effectively not all the same size and/or are not on a regularly spaced grid), and the correction is approximate with residuals at the 0.5% level photometrically.
Please also note that the dome flats contain light from the pupil image of the primary mirror: It appears as a donut in the properly normalized flat field frames of the whole camera. The amplitude of the donut is typically 1.5%, but varies strongly with filter. The pupil image (donut) it is strongest in the g and z bands (3% level).
- bad pixel mask
A set of bad pixel maps are kept for each CCD. These bad pixels are masked and interpolated over.
- pupil correction
An additive correction is constructed for each exposure, based on the 'star flat' and the level of sky (+scattered light, including the night-sky pupil image) present on each CCD. This additive level is estimated (from the sky level on each CCD), and is scaled and subtracted from each CCD. This technique is imperfect, and can leave gradients of several percent (worst in z and Y band) in the sky remaining in the reduced, processed science images. Users may with to perform their own sky fitting and subtraction procedure with these images. This procedure will be updated in future releases.
- illumination correction
The relative response of different areas of each ccd is constructed by observing a dense star field many times in a dithered pattern on the sky. This is called a 'star flat sequence'. The relative brightnesses of the same star's light falling at different locations on different ccds is used to construct a low order (approximately 4th order polynomial) fit to the response of the camera for each ccd.
This response is divided out of each science exposure using the 'illumination correction' frames. The residual differential response, after dividing by the illumination correction, is typically < 2% peak-to-peak at any part of the camera in any filter grizY.
Note that the subtraction of the pupil image does not affect, to first order, the illumination response correction.
That is, your star and galaxy photometry will still be uniform across the DECam field even if you perform an additional or alternate sky subtraction on these images. The exception is for very large extended objects, such as large galaxies, where a gradient in the sky can affect the photometry.
- sky background -- not subtracted
We measure the sky level in each ccd, however we do not subtract off a sky background from these images. The sky counts remain with each ccd.
These sky counts are only an approximation, since the illumination and pupil corrections will affect the residual sky level.
- fringe frame correction
Fringing is visible in the z and Y band exposures (only).
It is strongest in the Y band, and the pattern in the z and Y band is essentially identical, differing only in amplitude. A set of templates constructed from a stack of z and Y band DES Science Verification frames was averaged and is used as a fringe frame. CCDs near the center of the camera (ccds 28, 35) have the strongest fringe pattern.
Each CCD of each science exposure in z,Y has its sky level measured, and this sky level is used to scale the fringe frame, which is then subtracted. This method of scaling-by-ccd (rather than scaling the whole set of 60 ccds at once for a given exposure) is sub-optimal, and will be improved in the future. The scaling method is identical, currently to that used to scale and subtract the pupil pattern.
- Astrometric solution -- WCS
Bright stars (including lightly saturated stars, that is stars with magnitudes in these 90s exposures of riz ~ 16th magnitude) are detected on each ccd of each exposure, and their x,y pixel positions are recorded. The boresight pointing of the telescope serves and initial guess (RA,DEC), and are fed with the list of x,y's to SCAMP to determine the astrometric (WCS) solution for each single exposure.
See the Astrometry sections above for more details. The WCS (good to cubic order) terms of the solution are written to each CCDs FITS image header.
- saturated star bleeding, edge bleed and satellite trail detection and
masking
Very bright stars (a 90s DECam exposure saturates at approximately magnitude 16) leave charge overflow (bleed) trails on both sides of the star image. These trails are masked by the processing software, and currently these trails are interpolated over. The weight of saturated pixels in the weight map plane is set to zero.
Extremely bright oversaturated stars leave a secondary effect in the readout register of each ccd, this is called the 'edge bleed'. Edge bleeds may be located some distance from the bright star responsible for them. These edge bleed areas are masked.
A custom routine searches for long narrow trails due to satellites, airplanes and meteors. These trails are masked in the masked plane.
Note that the PSF of bright stars in the Y-band shows a projection perpendicular to the bleed trail direction. This is part of the Y-band PSF and is due to the properties of the infrared light as it reflects within the deep-well DECam CCDs.
- cosmic ray detection and masking
Cosmic ray events are detected on single images using an algorithm adopted from the LSST software stack. The cosmic ray pixels are currently interpolated over in the image plane (this may change in future releases). They are also marked in the weight and bitmask planes.
- Final Reduced images
Following application of steps 1-12 above, the resulting 'reduced' images, separate for each ccd, with accompanying weight planes and bitmap masks, are written out as FITs files. The CFITS IO fpack routines (available from NASA) are used to compress these images (.fz compression).
Please use the latest CFITS IO version (3.36 or later to unpack these images and maps).
NOAO repackages and rescales all CCDs in an image to a common zeropoint. If DES was unable to determine an accurate zeropoint due to an exposure having insufficient overlap with its neighbors (Tucker et al. in prep), then that zeropoint is left out of the image header, and an estimated zeropoint is determined by NOAO by taking a median of zeropoints of neighboring ccds, similarly calibrated. If the exposure was obtained in non-photometric conditions, then this zeropoint may be off by several percent depending on the variable amount of clouds over the different parts of the camera. DES doesn't vouch for the accuracy of these estimated zeropoints.
Tables of Y1A1 Exposures
- NITE -- Night of observation YYYYMMDD (UT)
- EXPNUM -- Unique Exposure Number
- F -- Filter g,r,i,z,Y
- ETIME -- Exposure time (s)
- RA J2000 (deg) of Camera Boresight
- DEC J2000 (deg)
- FWHM seeing (arcsec)
- ELLIP ellipticity (average of a set of stars and galaxies in the field)
- teff Tau_effective 1.0 = full quality exposure; < 0.3 usually means unacceptable S/N
- xsig rms of coord 1 astrometric scatter vs. UCAC-4 reference catalog (arcsec)
- ysig rms of coord 2 astrometric scatter vs. UCAC-4 reference catalog (arcsec)
- xoff offset of coord 1 astrometric position vs. UCAC-4 reference catalog (arcsec)
- yoff offset of coord 2 astrometric position vs. UCAC-4 reference catalog (arcsec)
- internal DESDM run number -- used to locate files in DESDM disk archive system